Home prices across Texas have spiked over the past five years. In fact, from 2020 to 2023, the median Texas home price jumped from $259,990 to $335,000—a 28.85% increase.
With these home price increases often come higher market and assessed values, thus soaring property taxes.
At Ownwell, we set out to see if homeowners who successfully protested their property taxes would see a similar property value to those who hadn’t protested the following year.
Theoretically, all properties should have comparable market values across counties and municipalities regardless of who protested in previous years.
Our research revealed that this isn’t the case. Across counties, those who protested and received a reduction often had lower market values the following year than those who didn’t protest.
Across seven densely populated counties in Texas, we compared the year-over-year (YoY) market values of homes that didn’t protest their property taxes (no reduction) against those that successfully protested (received a reduction). We also calculated the total savings from protestors and what non-protestors could have saved had they protested in each of the past three years. Our full methodology is below.
Below are our top takeaways from across the state and by each county.
Top Texas Takeaways
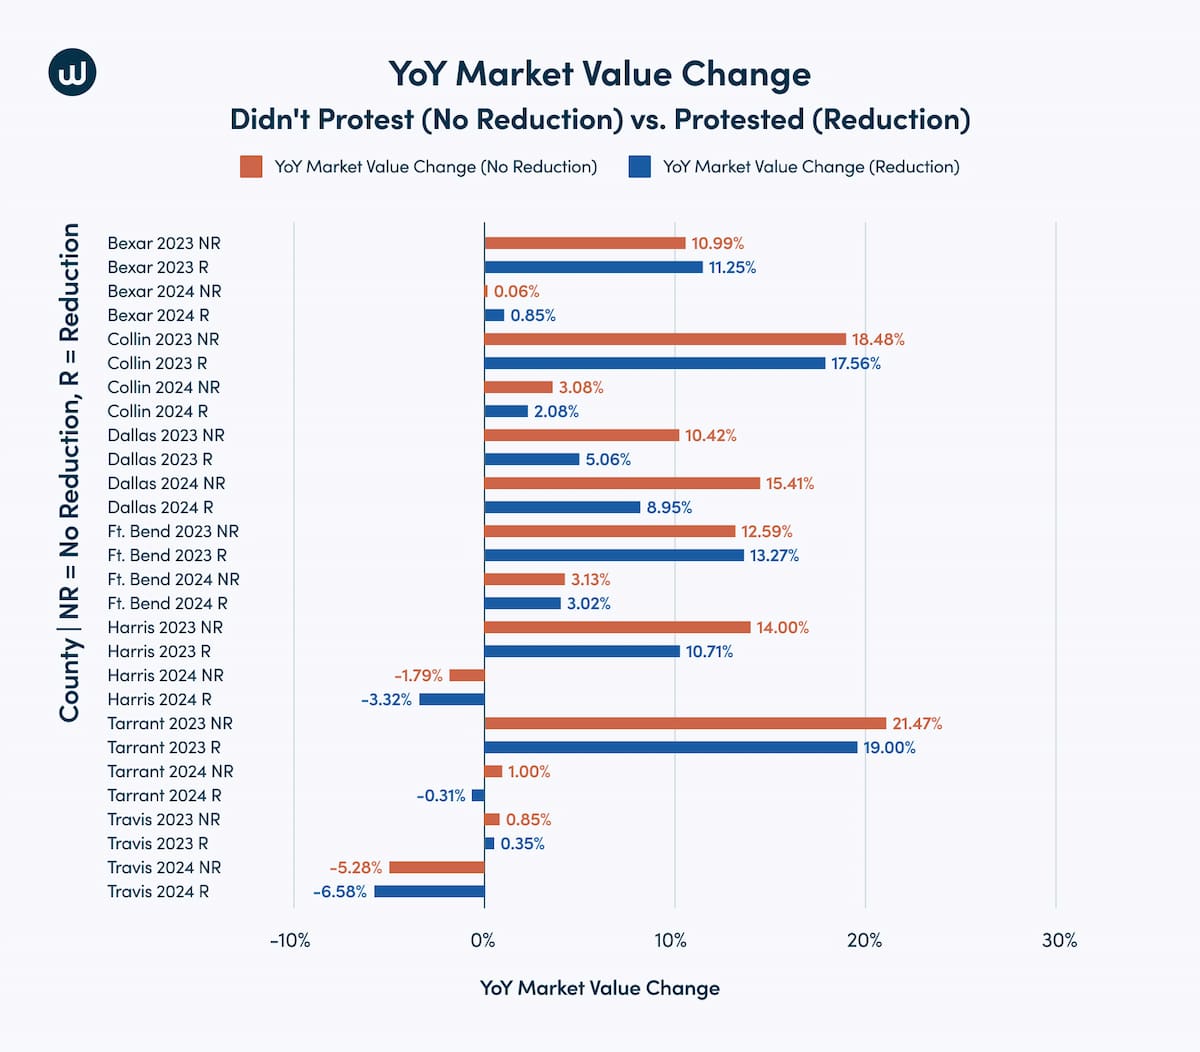
Annual average market value increase:
In 2023, homeowners in the seven Texas counties we studied who didn’t protest their taxes had an average market value 1.58% higher than those who protested. In 2024, this dropped by 0.2% to 1.38%.
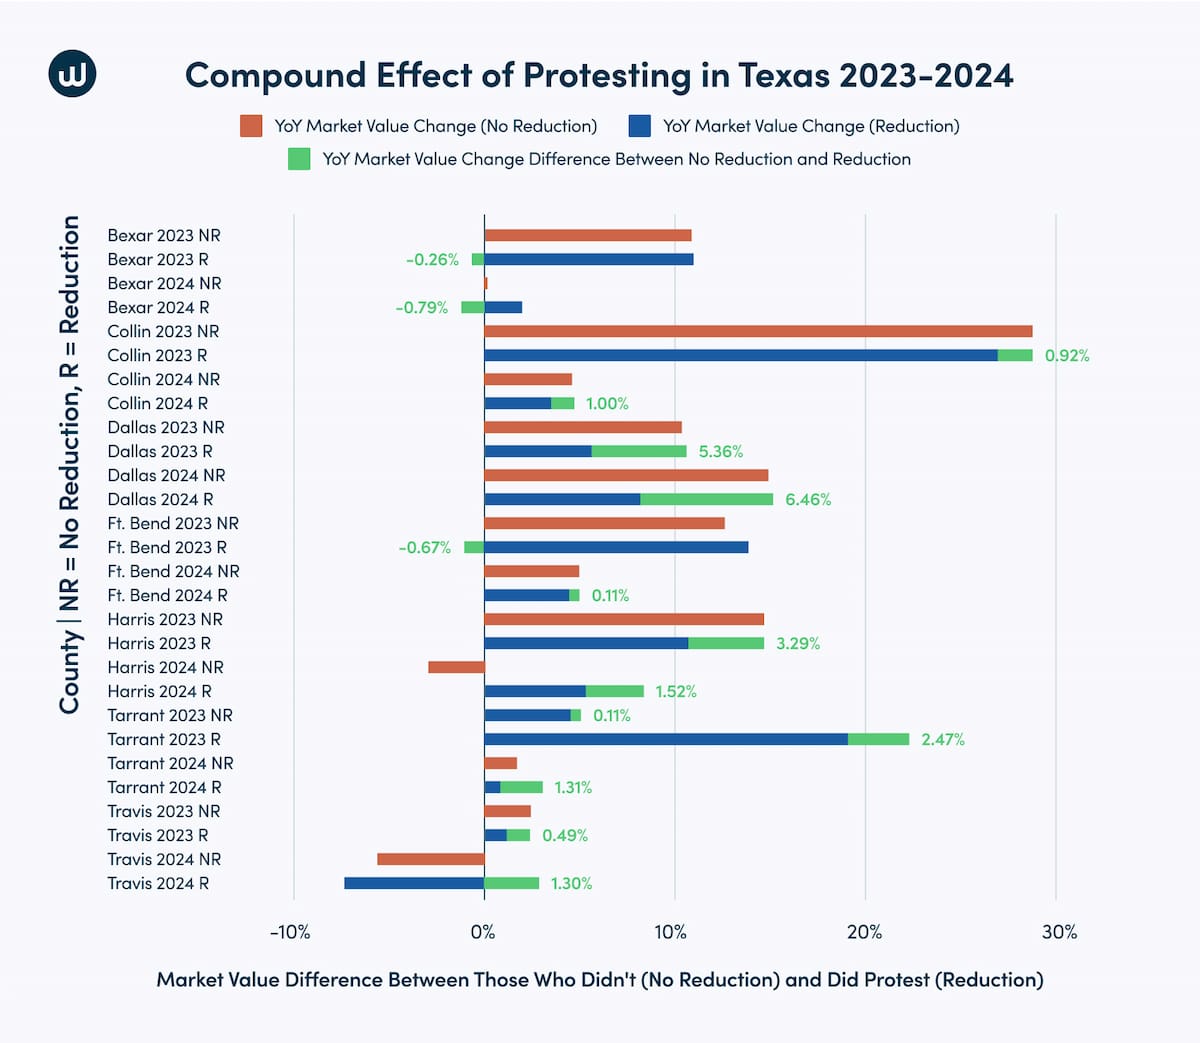
Cumulative market value increase:
Homeowners in these seven counties who didn’t protest had an accumulative 11.11% higher market value in 2023 and 10.91% in 2024 than those who protested.
From 2022 to 2024, this equated to $2.0217 billion in potential tax savings! In 2024 alone, it equated to $722.35 million in possible tax savings.
Clearly, across Texas, YoY market values increased more for those who didn’t protest than those who did.
The three largest YoY market value differences between no protest vs. protested in 2023:
Dallas County at 5.36%
Harris County at 3.29%
Tarrant County at 2.47%
The three largest YoY market value differences between no protest vs. protested in 2024:
Dallas County at 6.46%
Harris County at 1.52%
Tarrant County at 1.31%
Note that even when the market value went down in certain counties, homeowners who protested reduced their property’s market value and thus their property taxes more than those who didn’t protest.
For example, in 2024, Harris County property values corrected after significant growth in 2023. Those who didn’t protest saw their property’s market value drop 1.79%, while those who protested received a 3.32% valuation reduction—1.52% more!
Percentage of homeowners that protested in 2024 and total tax bill savings:
Bexar: 18.4% | $46.12 million
Dallas: 22.0% | $19.78 million
Collin: 26.4% | $42.17 million
Tarrant: 29.1% | $8.82 million
Fort Bend: 29.5% | $194.09 million
Harris: 31.0% | $108.92 million
Travis: 41.45% | $146.18 million
Seven-County Average: 28.3% | $80.87 million
How Homestead Caps Affected Market Value
You’ll notice that in some counties, the average reduction increased even though the total worth of all homes decreased. This is because of the homestead caps. In Texas, the assessed value can only go up 10% each year. For instance, in 2022, market values went up drastically in Travis County, causing many properties to become homestead-capped at a 10% increase. Thus, even if homeowners got a 9% property tax reduction in 2022, many properties' savings would be at or near zero since they likely wouldn’t beat the cap.
In 2023 and 2024, the market was flat or slightly down in Travis County; meaning the caps caught up. So, more properties became uncapped, and homeowners could save money if they achieved a 9% or greater reduction.
Bexar County
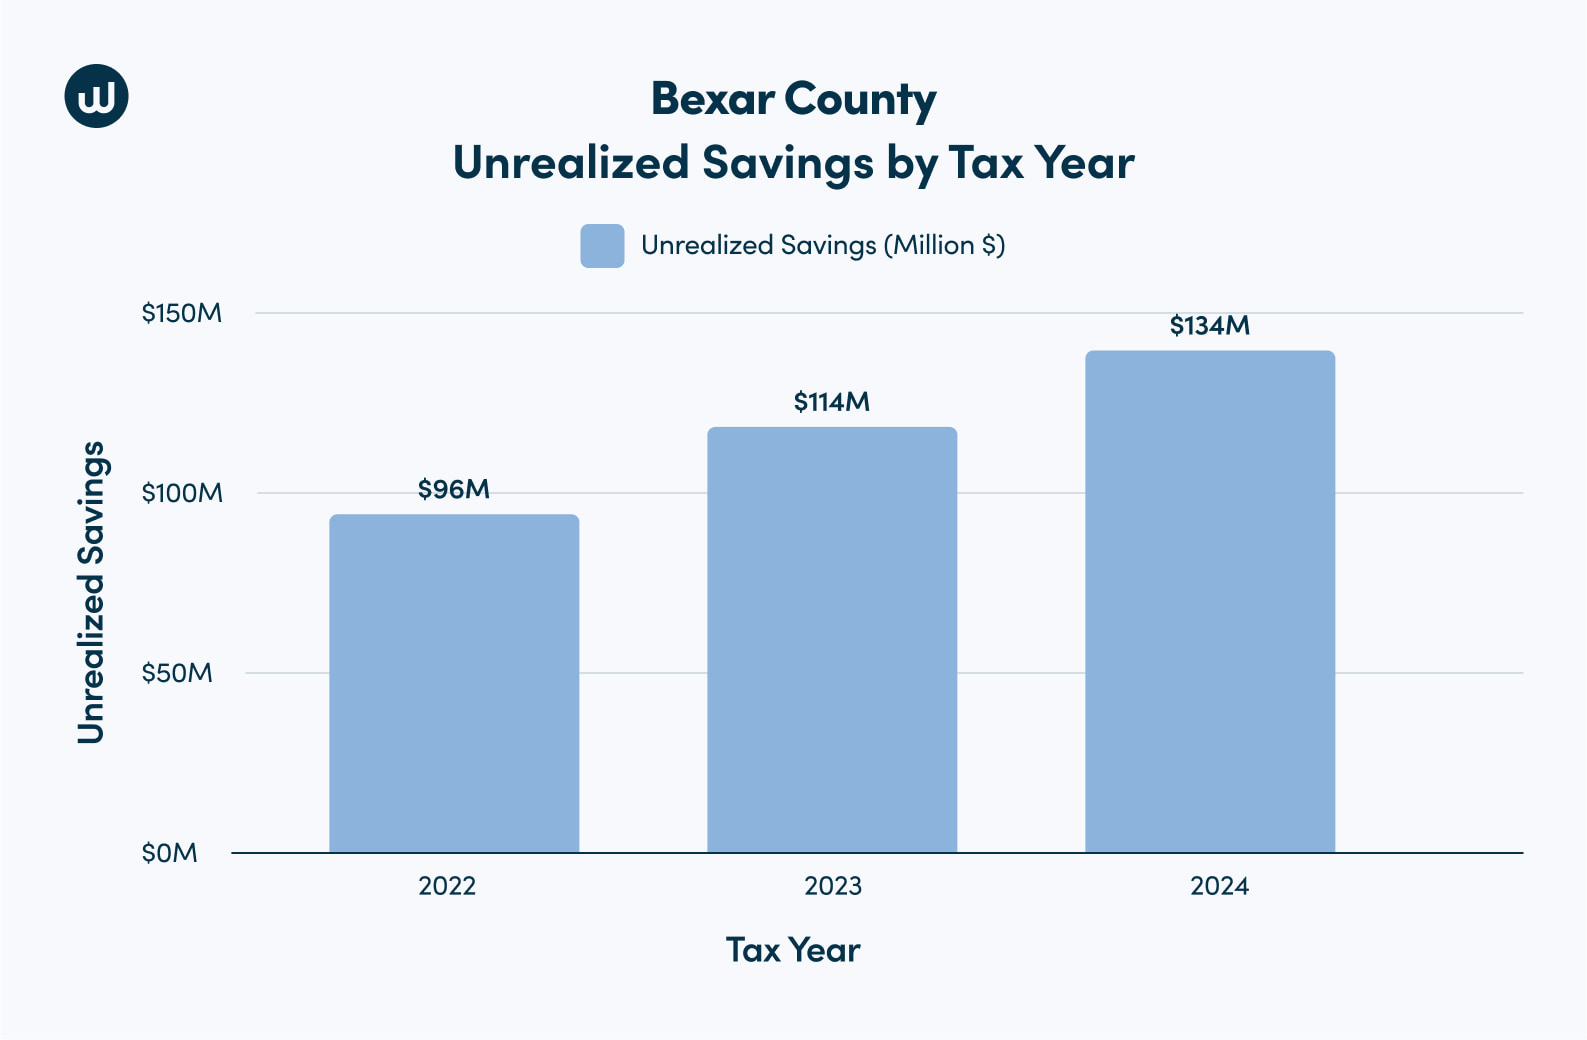
In 2024, 497,508 Bexar County homeowners didn’t protest their property taxes. Together, these 497,508 homes’ market values totaled $146 billion. However, if they had protested in 2024, they could’ve collectively saved over $134 million— averaging $269 per household. From 2022 to 2024, these unrealized savings totaled $344 million.
In comparison, those who successfully protested saved $46.12 million in 2024 and a collective $89.34 million over the past three years.
Bexar County by the Numbers:
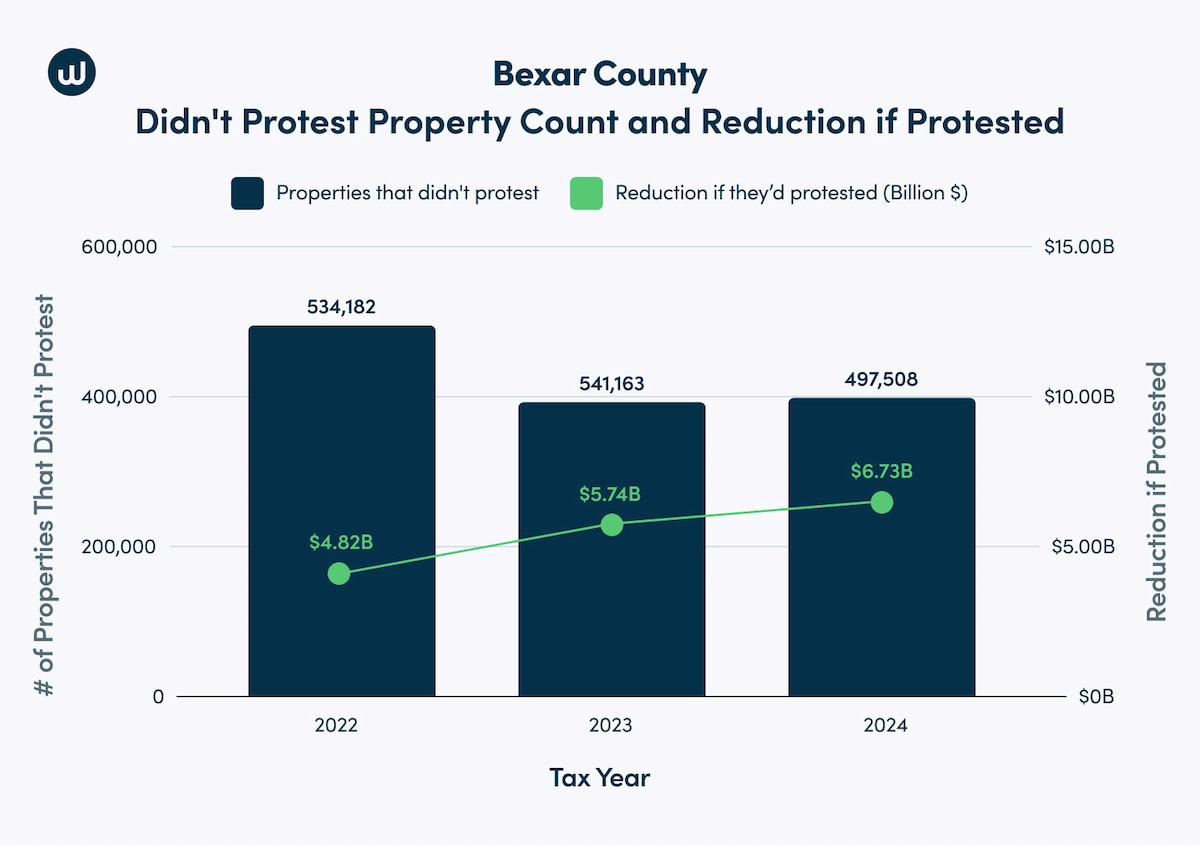
Success Rate, Reduction, and Savings:
Percentage of Bexar County properties that protested:
2022: 10.9%
2023: 11.2%
2024: 18.4%
The average success rate for homeowners who protested (2022-2024): 88.2%
Average three-year reduction in property valuation when won: 6.7%
Total 2024 tax bill savings from successful protestors: $46.12 million
Total 2022 to 2024 savings from successful protestors: $89.34 million
Number of households who chose not to protest in 2024: 497,508 (81.6%)
Unrealized Savings and Compound Cost of Not Protesting:
Bexar County market value differences between non-protestors (no reduction) and successful protestors (received a reduction):
2023: -0.26%
2024: -0.79%
In 2024, homeowners who didn’t protest missed out on potential savings totaling over $134 million.
From 2022-2024, non-protesting Bexar County homeowners could’ve saved $344 million in property taxes.
Collin County
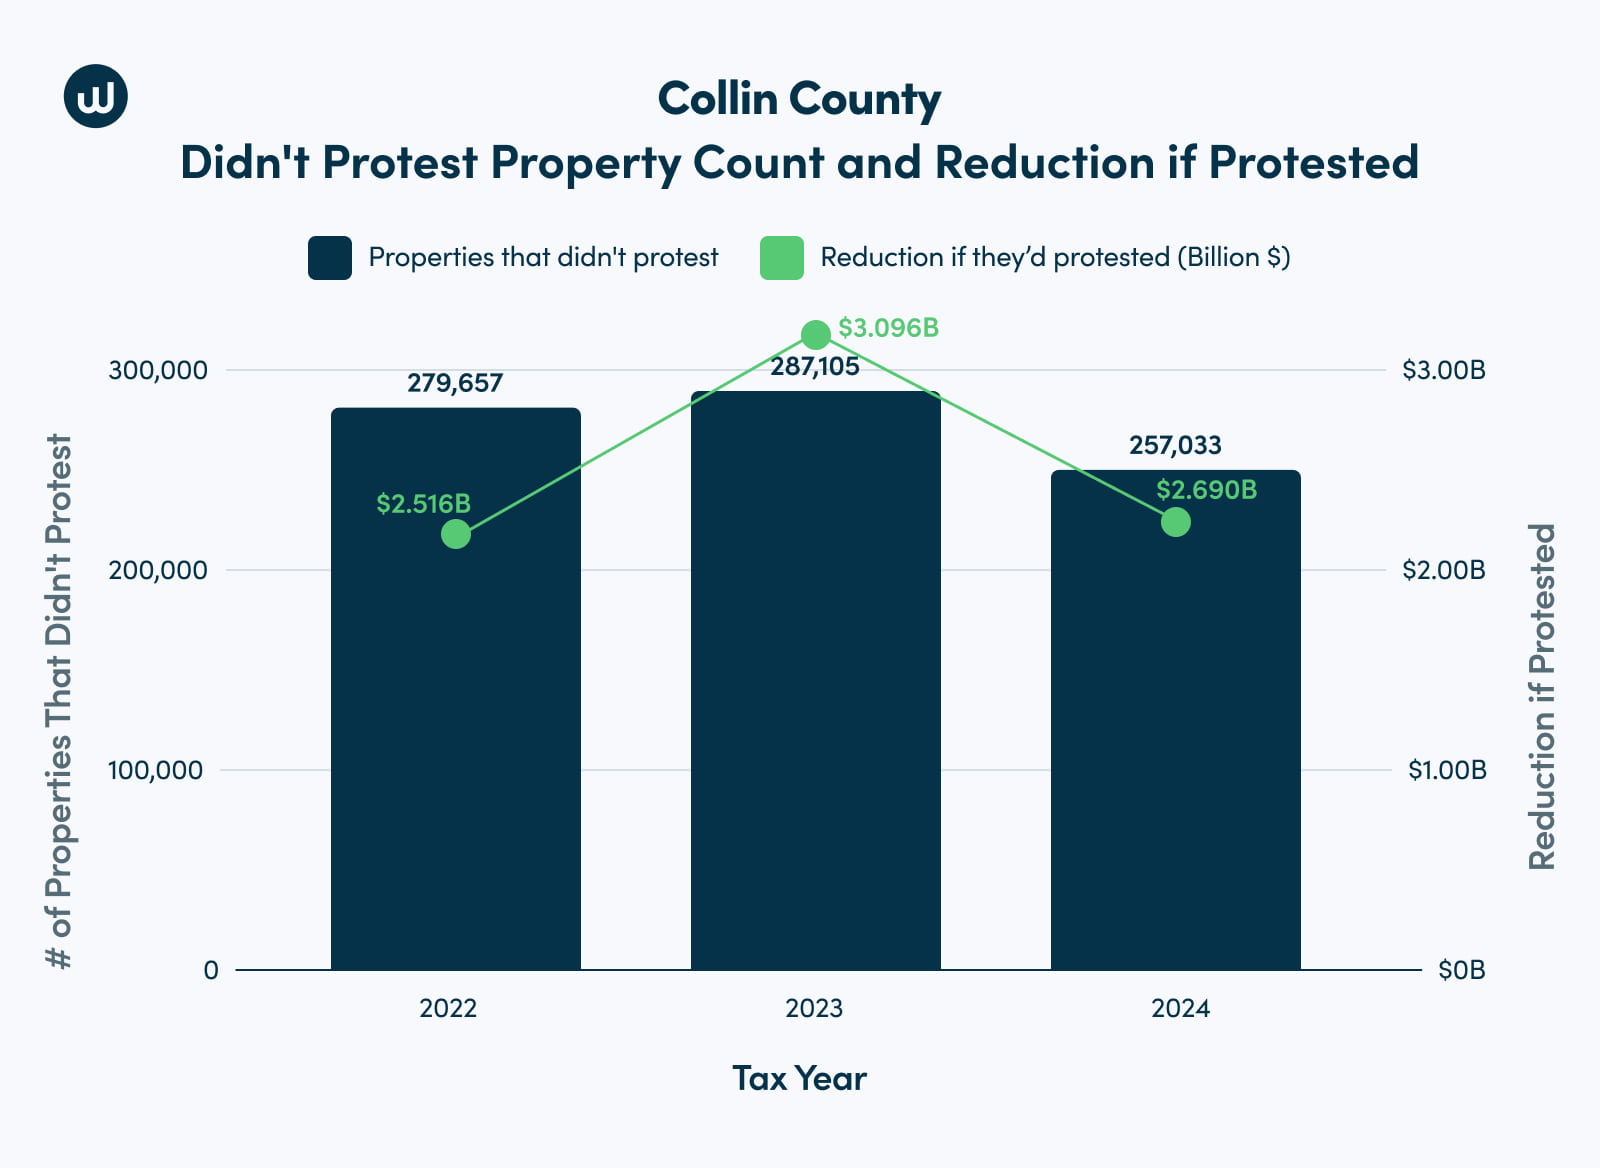
In 2024, 257,033 Collin County homeowners didn’t protest their property taxes. Together, these 257,033 homes’ market values totaled $57 billion. If they’d protested, these Collin County homeowners would’ve reduced their assessed value by $8.3 billion over the past three years.
From 2022 to 2024, those who protested had a 54.7% success rate—the lowest among all counties studied and 25.6% less than the average. Moreover, the average reduction percentage of 5.1% was second to last among all seven counties, only slightly above For Bend’s 4.9%.
That said, those who successfully protested cumulatively saved nearly $37.49 million over the past three years!
Collin County by the Numbers:
Success Rate, Reduction, and Savings:
Percentage of properties that protested:
2022: 15.8%
2023: 18.2%
2024: 26.4%
The average success rate for homeowners who protested (2022-2024): 54.7%
Average three-year reduction in property valuation when won: 5.1%
Total 2024 tax bill savings from successful protestors: $19.78 million
Total 2022 to 2024 savings from successful protestors: $37.49 million
Number of households who chose not to protest in 2024: 257,033 (73.6%)
The estimated total reduction in assessed value for all Collin County non-protestors from 2022 to 2024 if they had protested: $8.3 billion
Unrealized Savings and Compound Cost of Not Protesting:
Collin County market value differences between non-protestors (no reduction) and successful protestors (received a reduction):
2023: 0.92%
2024: 1.00%
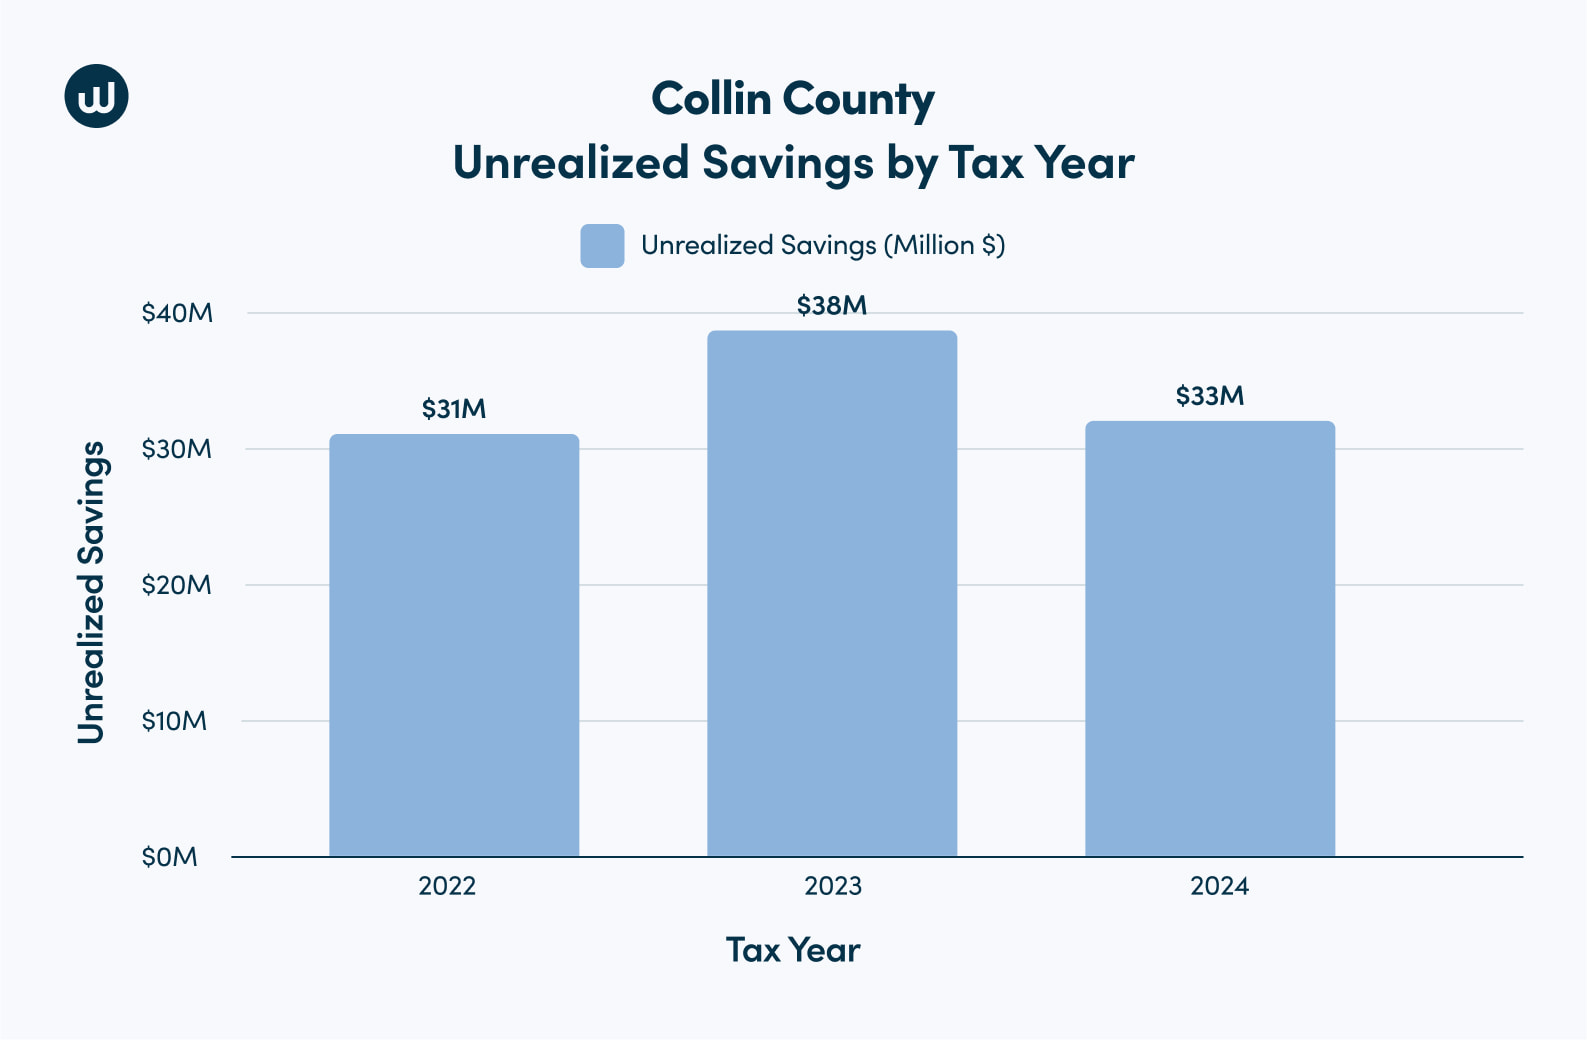
In 2024, homeowners who didn’t protest missed out on potential savings totaling $33 million.
From 2022-2024, non-protesting Collin County homeowners could’ve saved $102 million in property taxes.
Dallas County
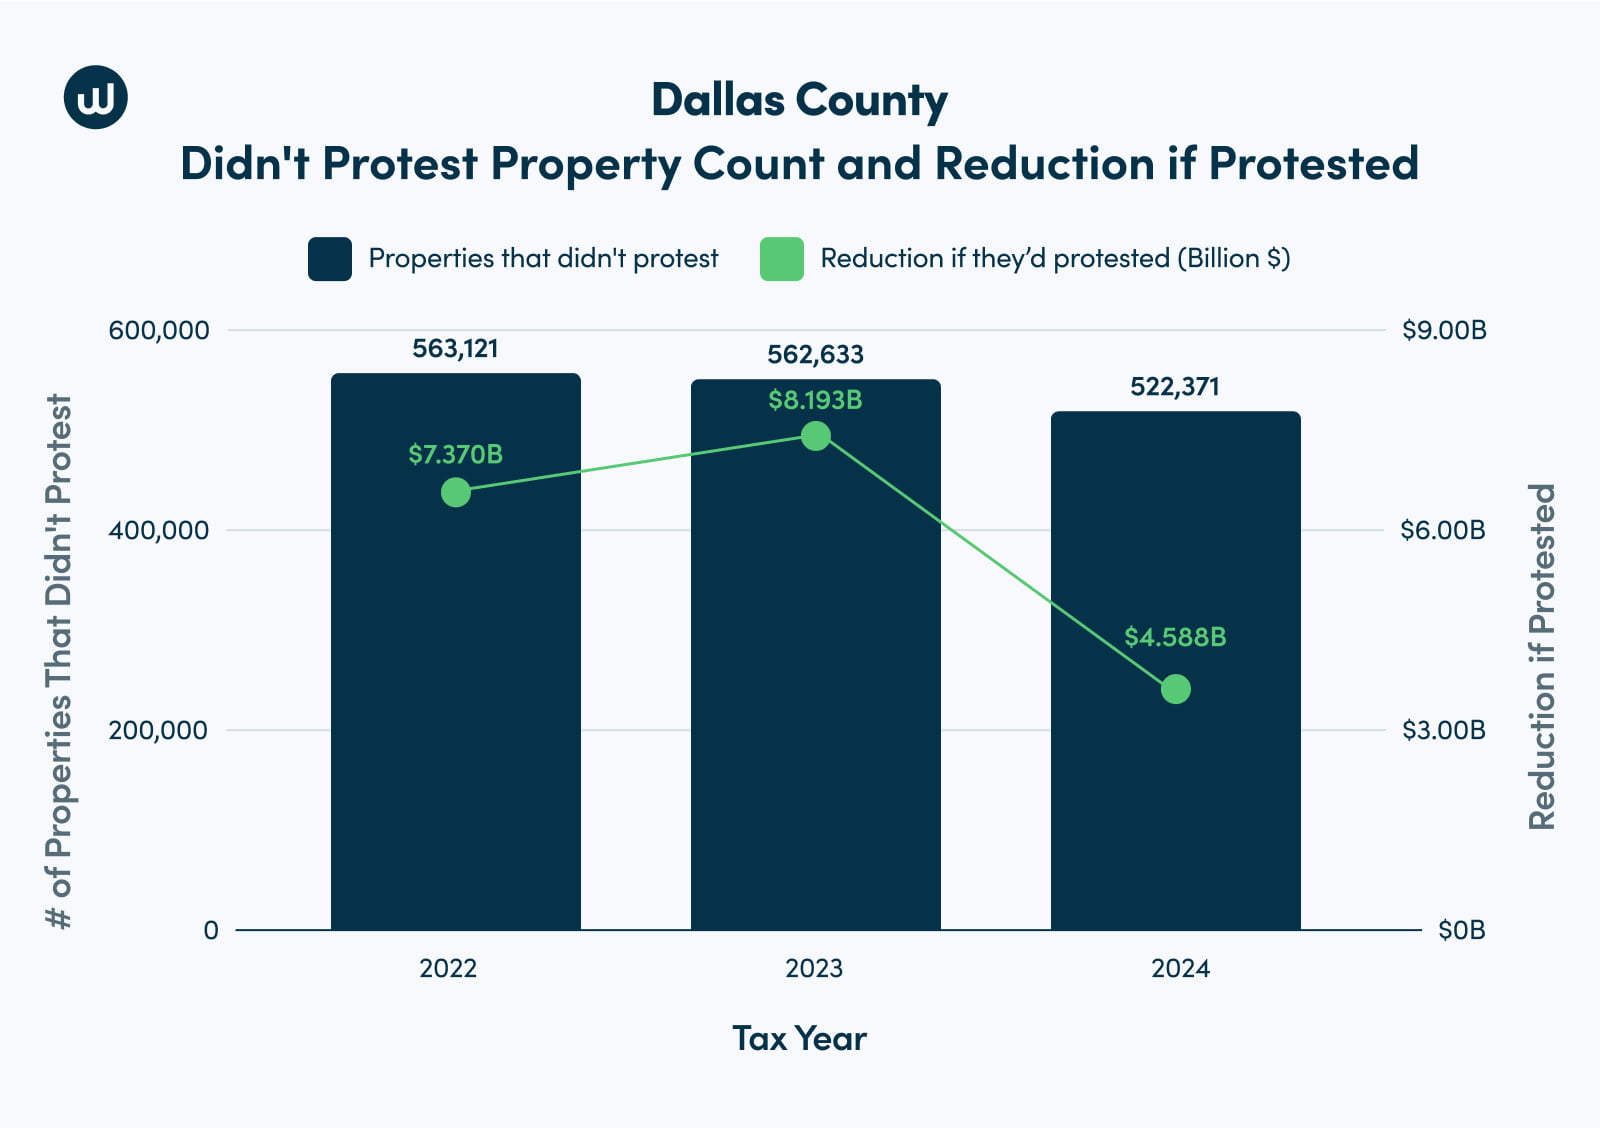
In 2024, 522,371 Dallas County homeowners didn’t protest their property taxes. Together, these 522,371 homes’ market value totaled $202 billion. Homeowners who didn’t protest would have reduced their combined assessed value by $20.15 billion over the past three years, third behind Harris (first) and Tarrant (second) County.
Those who protested had a 69.6% success rate across all three years. On top of that, Dallas had the greatest YoY market value differences between non-protestors and protestors in 2023 (5.36%) and 2024 (6.46%) compared to all counties.
Over these three years, protestors saved over $110 million on property tax bills.
Dallas County by the Numbers:
Success Rate, Reduction, and Savings:
Percentage of properties that protested:
2022: 13.2%
2023: 16%
2024: 22%
The average success rate for homeowners who protested (2022-2024): 69.6%
Average three-year reduction in property valuation when won: 6.6%
Total 2024 tax bill savings from successful protestors: $42.166 million
Total 2022 to 2024 savings from successful protestors: $110.01 million
The estimated total reduction in assessed value for all Dallas County non-protestors from 2022 to 2024 if they had protested: $20.15 billion
Unrealized Savings and Compound Cost of Not Protesting:
Dallas County market value differences between non-protestors (no reduction) and successful protestors (received a reduction):
2023: 5.36%
2024: 6.46%
Number of households who chose not to protest in 2024: 522,371 (78%).
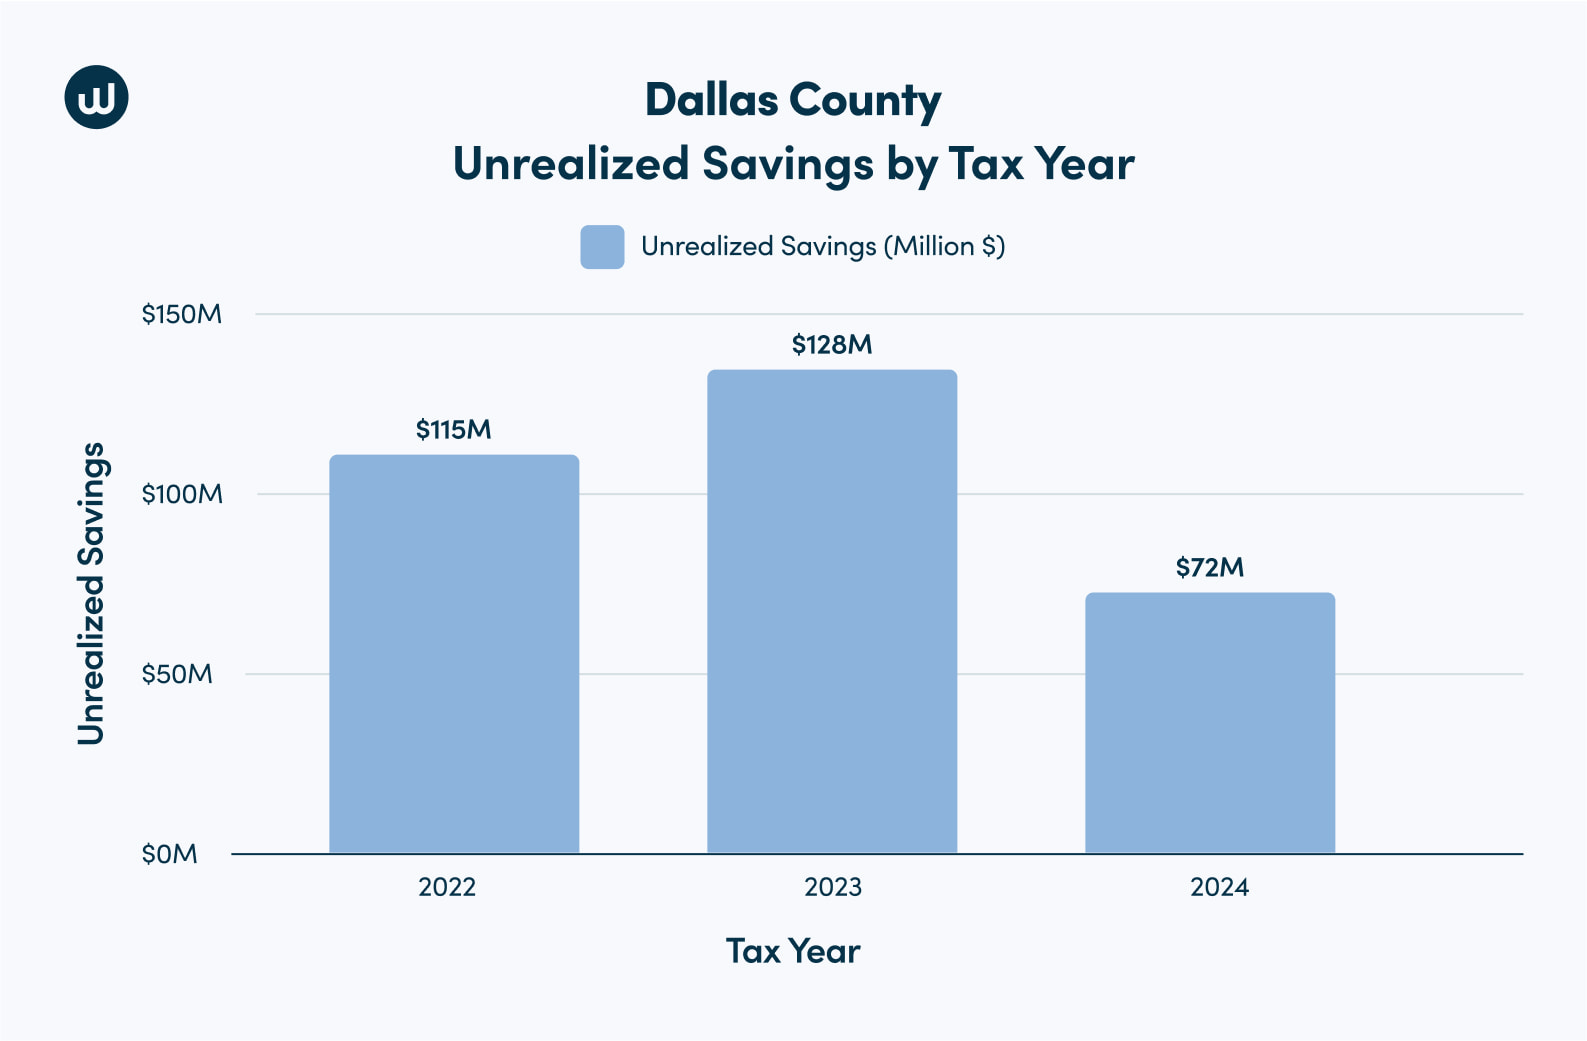
In 2024, homeowners who didn’t protest missed out on potential savings totaling $72 million.
From 2022-2024, non-protesting Dallas County homeowners could’ve saved $315 million in property taxes.
Fort Bend County
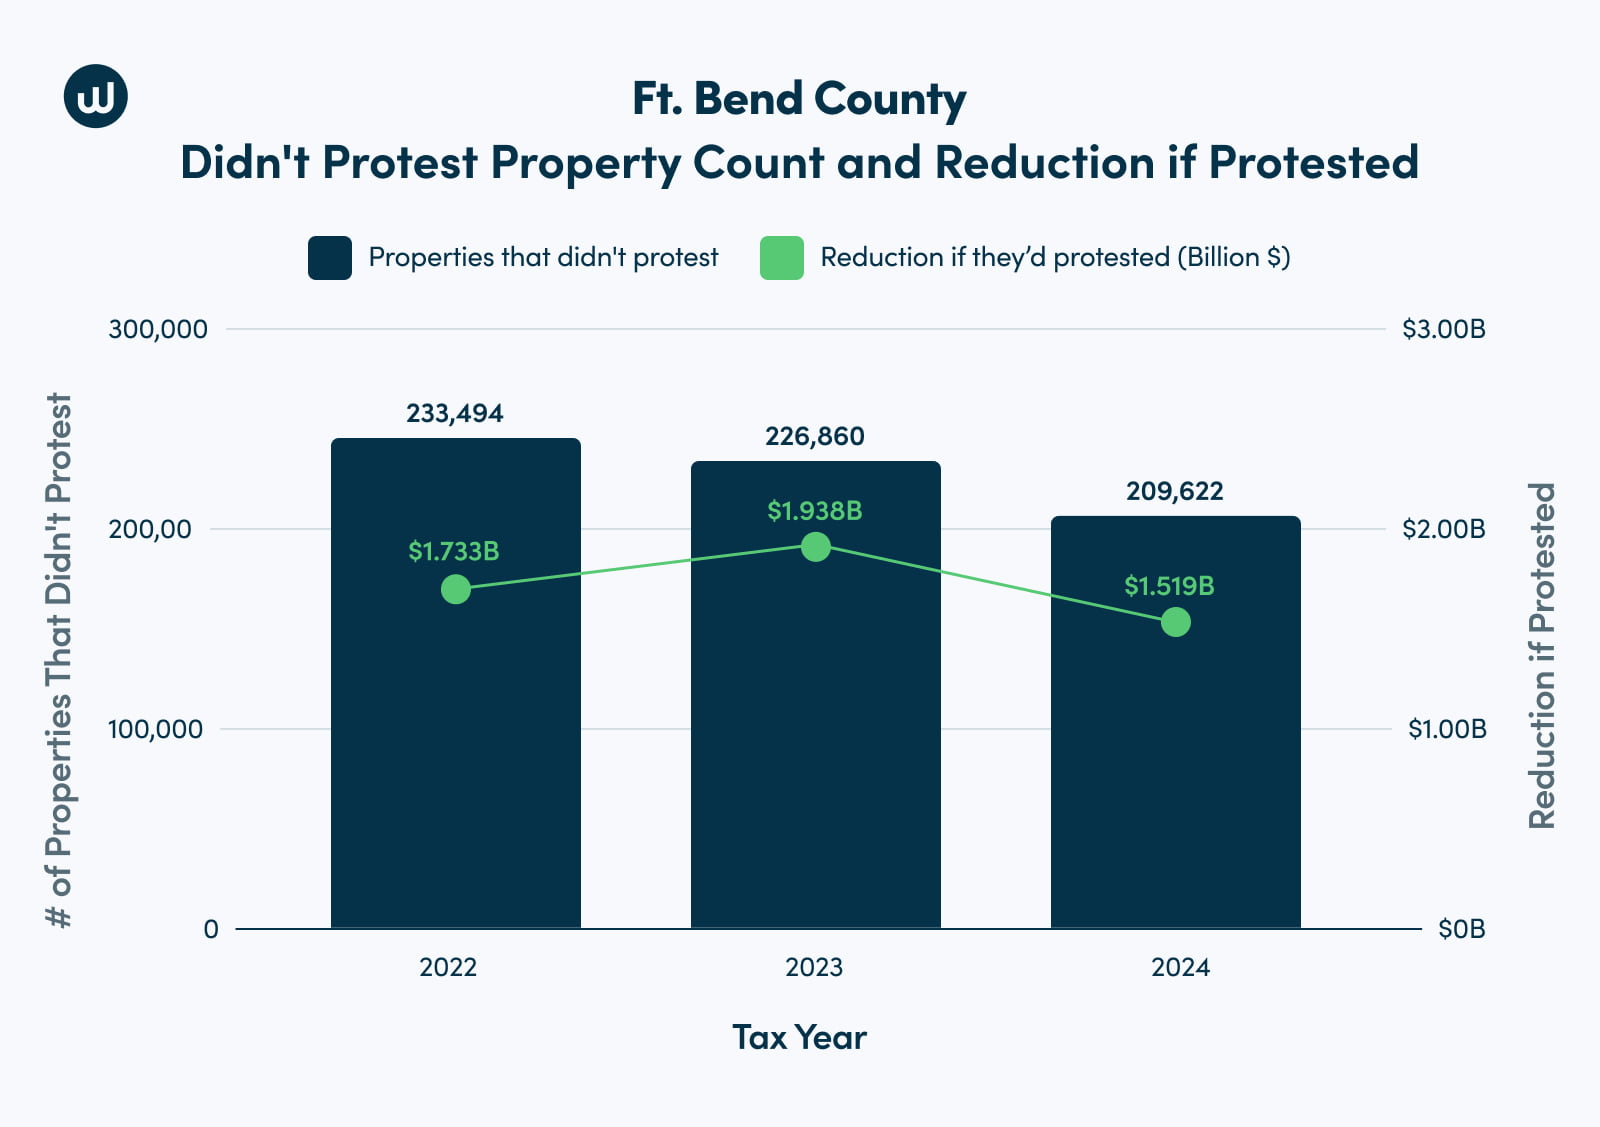
In 2024, 209,622 Fort Bend County homeowners didn’t protest their property taxes. Together, these 209,622 homes’ market value totaled $77 billion.
From 2022 to 2024, those who protested had a fair success rate, with an 86.5% success rate. However, Fort Bend residents had the lowest average reduction percentage, at 4.9%.
Despite a lower reduction than other counties, those that successfully protested lowered their property taxes by nearly $29.5 million over the past three years.
Fort Bend County by the Numbers:
Success Rate, Reduction, and Savings:
Percentage of properties that protested:
2022: 18.9%
2023: 22.9%
2024: 29.5%
The average success rate for homeowners who protested (2022-2024): 86.5%
Average three-year reduction in property valuation when won: 4.9%
Number of households who chose not to protest in 2024: 209,622 (70.5%)
Total 2024 tax bill savings from successful protestors: $8.82 million
Total 2022 to 2024 savings from successful protestors: $29.47 million
The estimated total reduction in assessed value for all Fort Bend County non-protestors from 2022 to 2024 if they had protested: $5.19 billion
Unrealized Savings and Compound Cost of Not Protesting:
Fort Bend County market value differences between non-protestors (no reduction) and successful protestors (received a reduction):
2023: -0.67%
2024: 0.11%
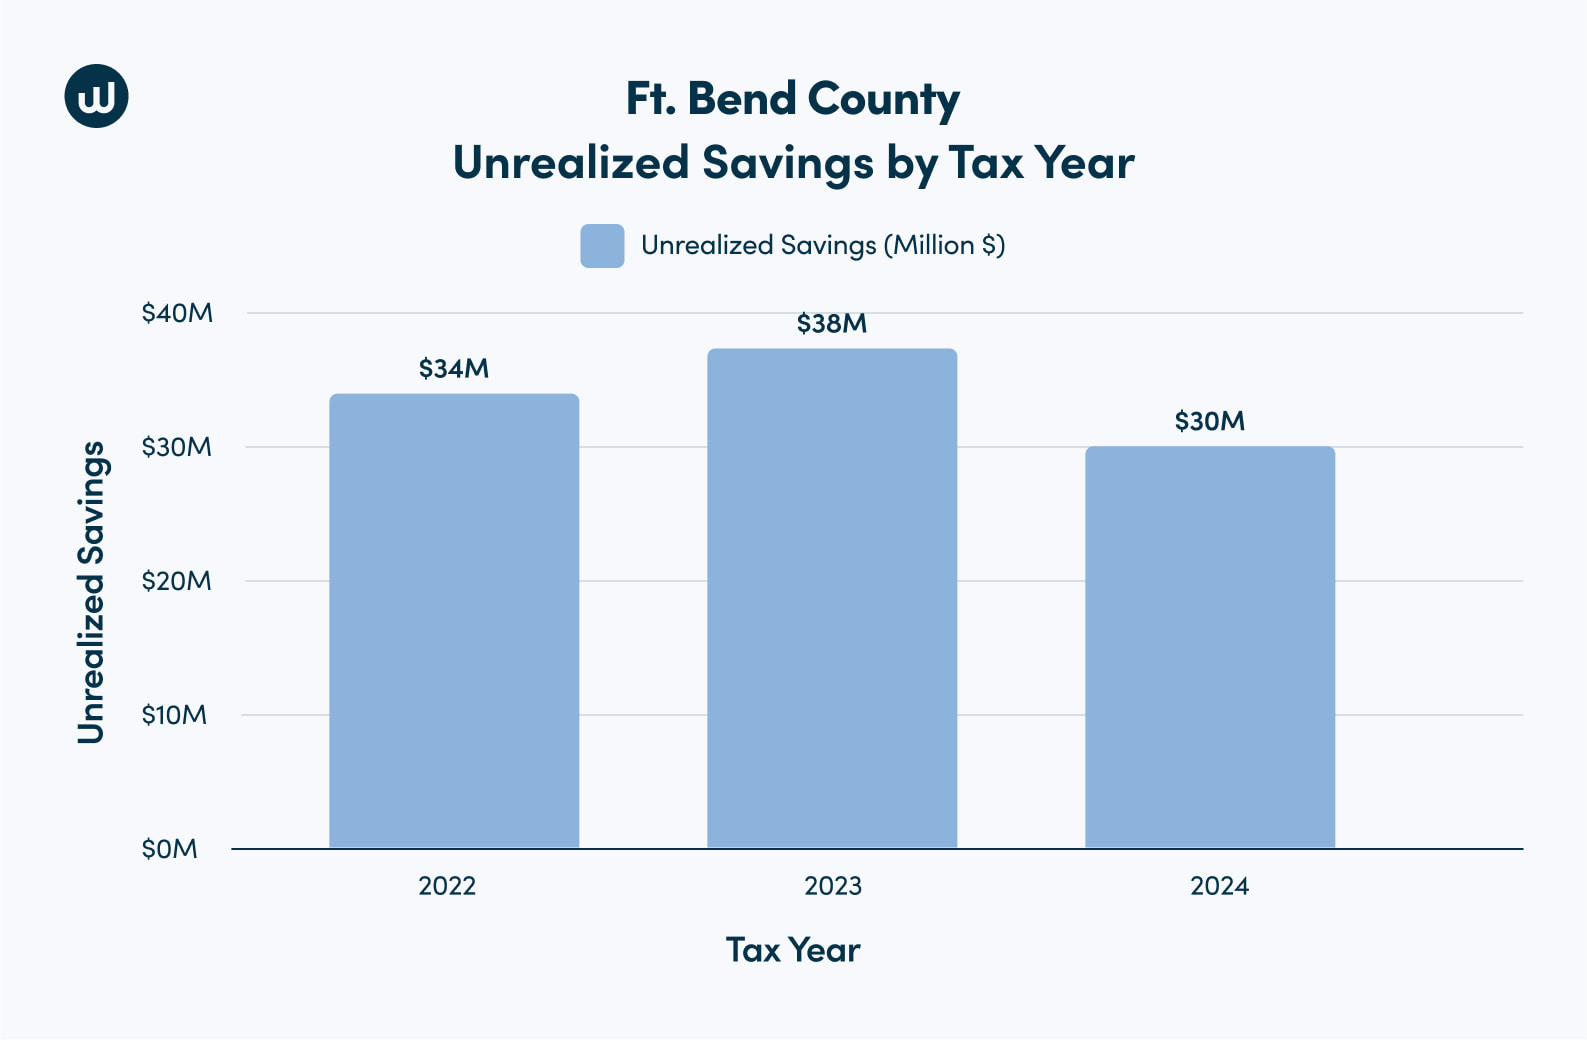
In 2024, homeowners who didn’t protest missed out on potential savings totaling $30 million.
From 2022-2024, non-protesting Fort Bend County homeowners could’ve saved $102 million in property taxes.
Harris County
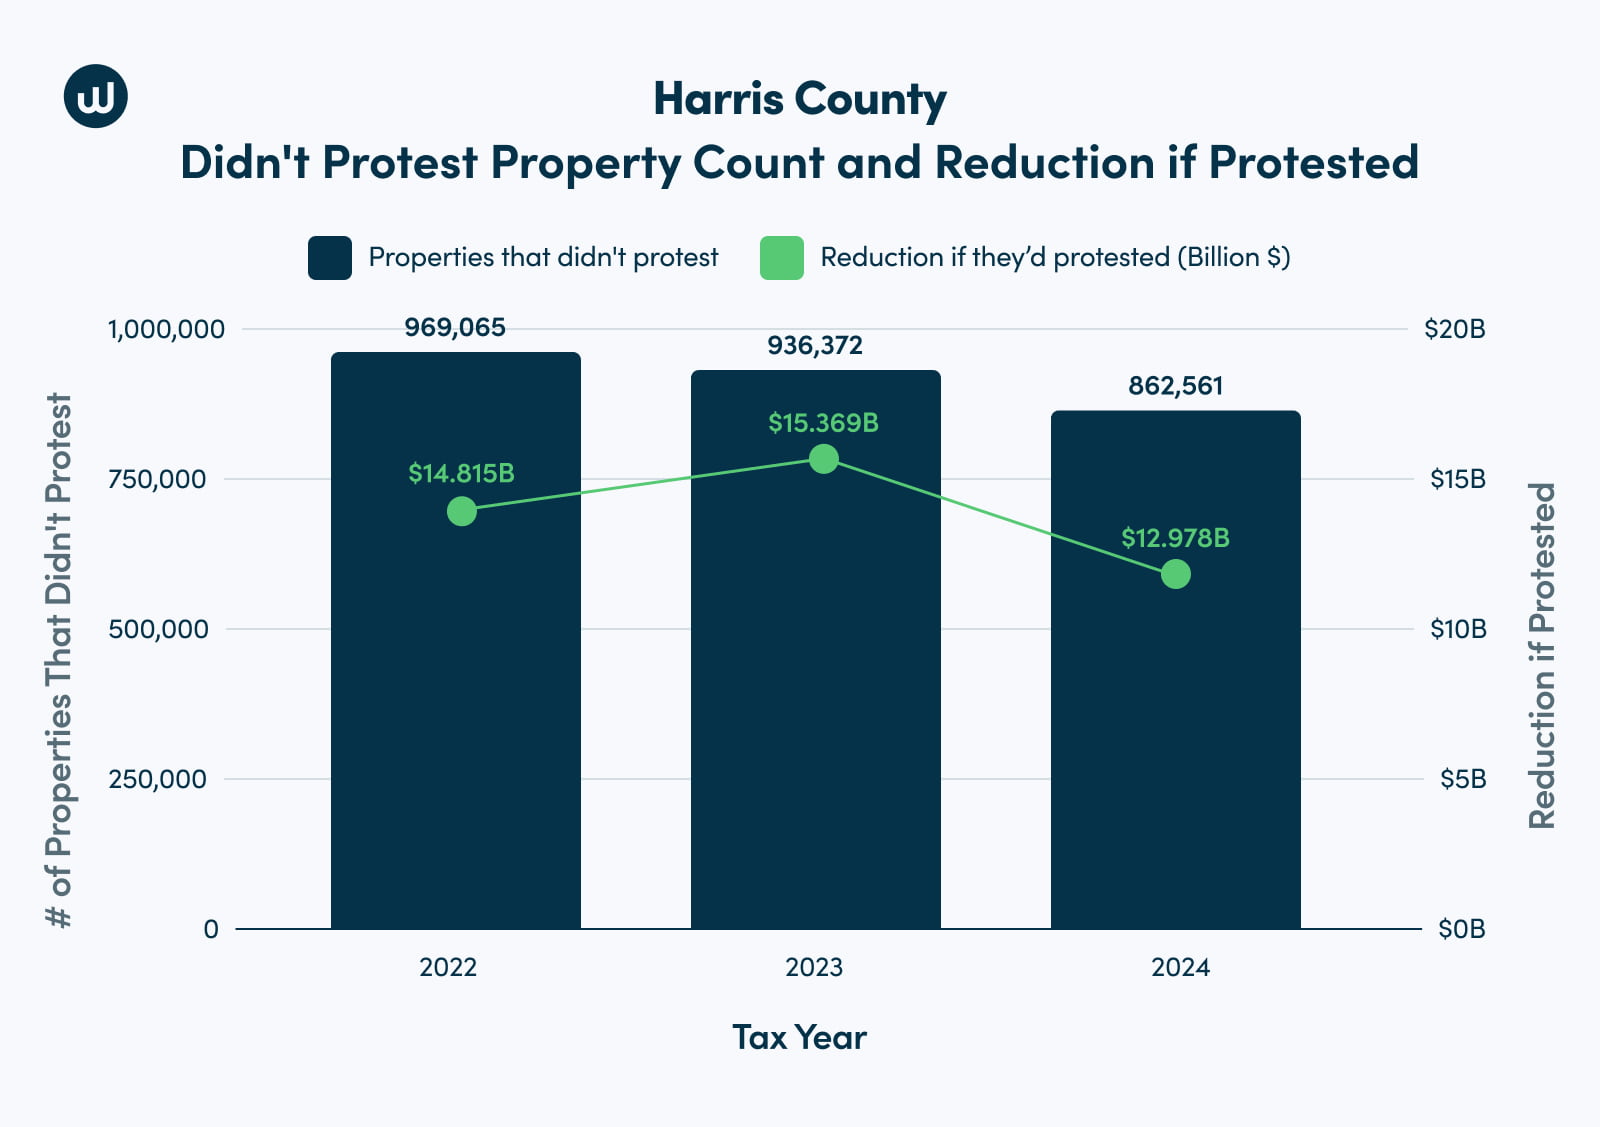
In 2024, 386,871 Harris County homeowners didn’t protest their property taxes. These non-protesting homes’ gross market value totaled $256 billion. If they’d protested in 2024, they could’ve saved $248 million on their property tax bills.
However, in 2024, Harris County had the second-highest percentage of residential protestors (31%), second only to Travis County. These residents averaged an 85% success rate, 4.7% more than the average for all counties.
Those who protested in 2024 likely owned higher-value homes since the 31% who protested possessed 42.3% of Harris County’s residential market value ($188 billion) and saved over $194 million.
Harris County by the Numbers:
Success Rate, Reduction, and Savings:
Percentage of properties that protested:
2022: 22.1%
2023: 24.9%
2024: 31%
The average success rate for homeowners who protested (2022-2024): 85%
Average three-year reduction in property valuation when won: 7.2%
Total 2024 savings from successful protestors: $194.09 million
Total 2022 to 2024 savings from successful protestors: $418.30 million
Number of households who chose not to protest in 2024: 522,371 (78%)
The estimated total reduction in assessed value for all Harris County non-protestors from 2022 to 2024 if they had protested: $43.16 billion
Unrealized Savings and Compound Cost of Not Protesting:
Harris County market value differences between non-protestors (no reduction) and successful protestors (received a reduction):
2023: 3.29%
2024: 1.52%
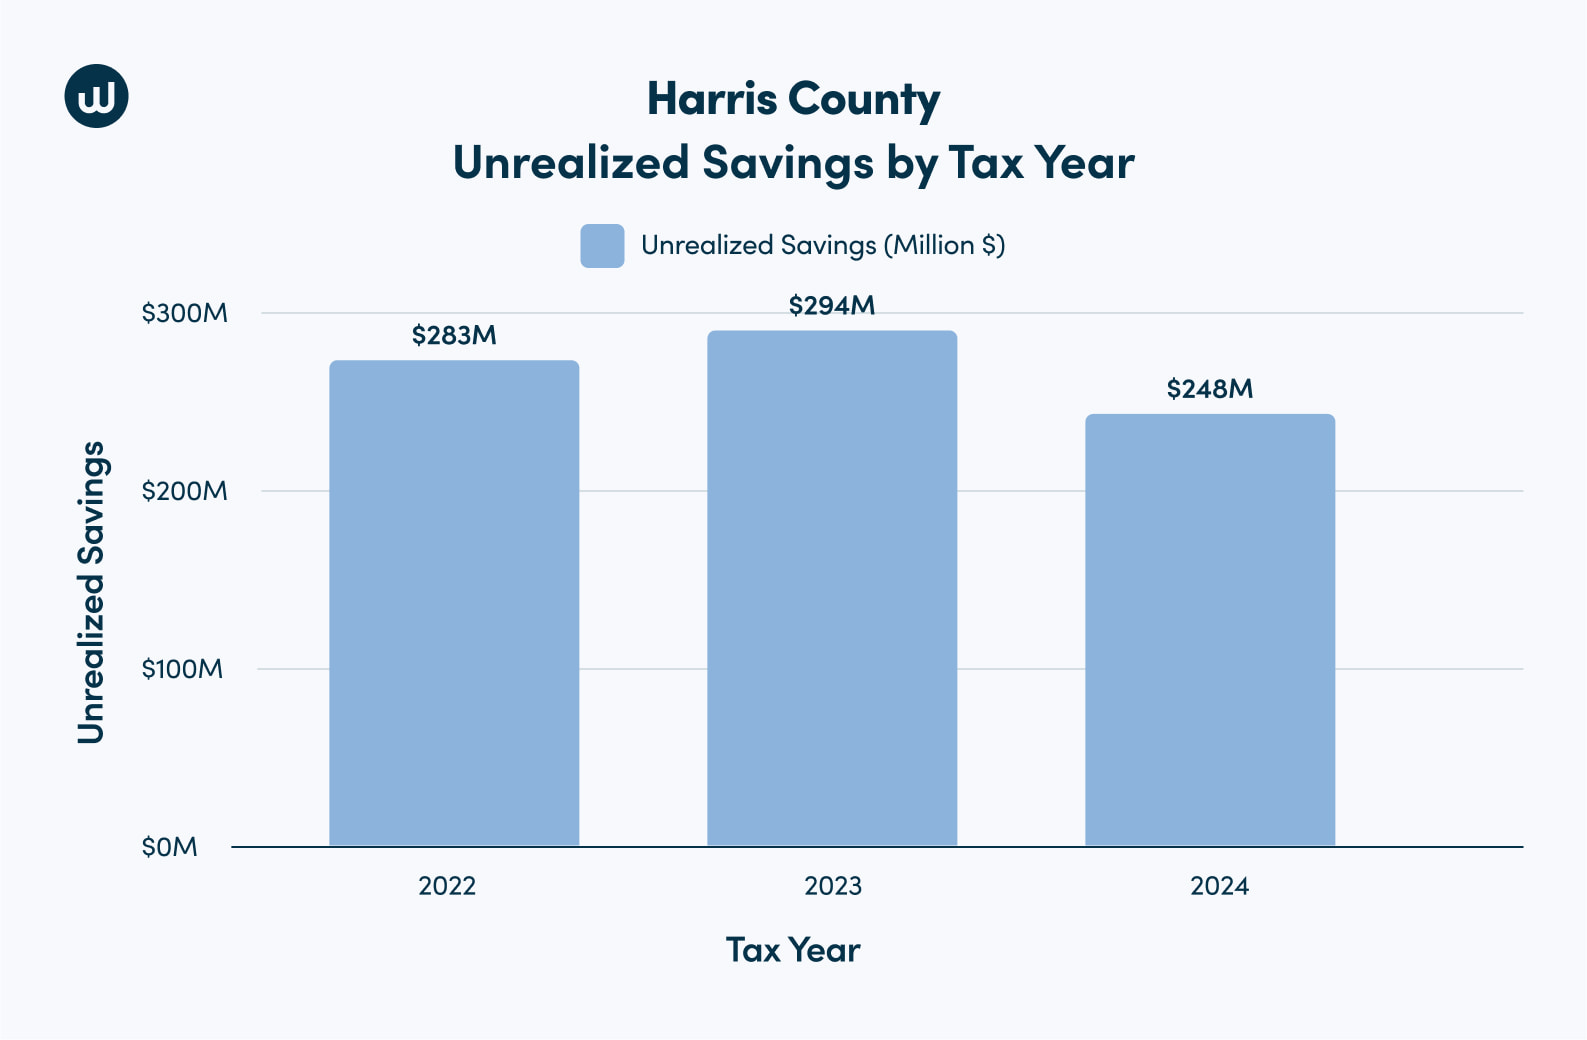
In 2024, homeowners who didn’t protest missed out on potential savings totaling $248 million.
From 2022-2024, non-protesting Harris County homeowners could’ve saved $825 million in property taxes.
Tarrant County
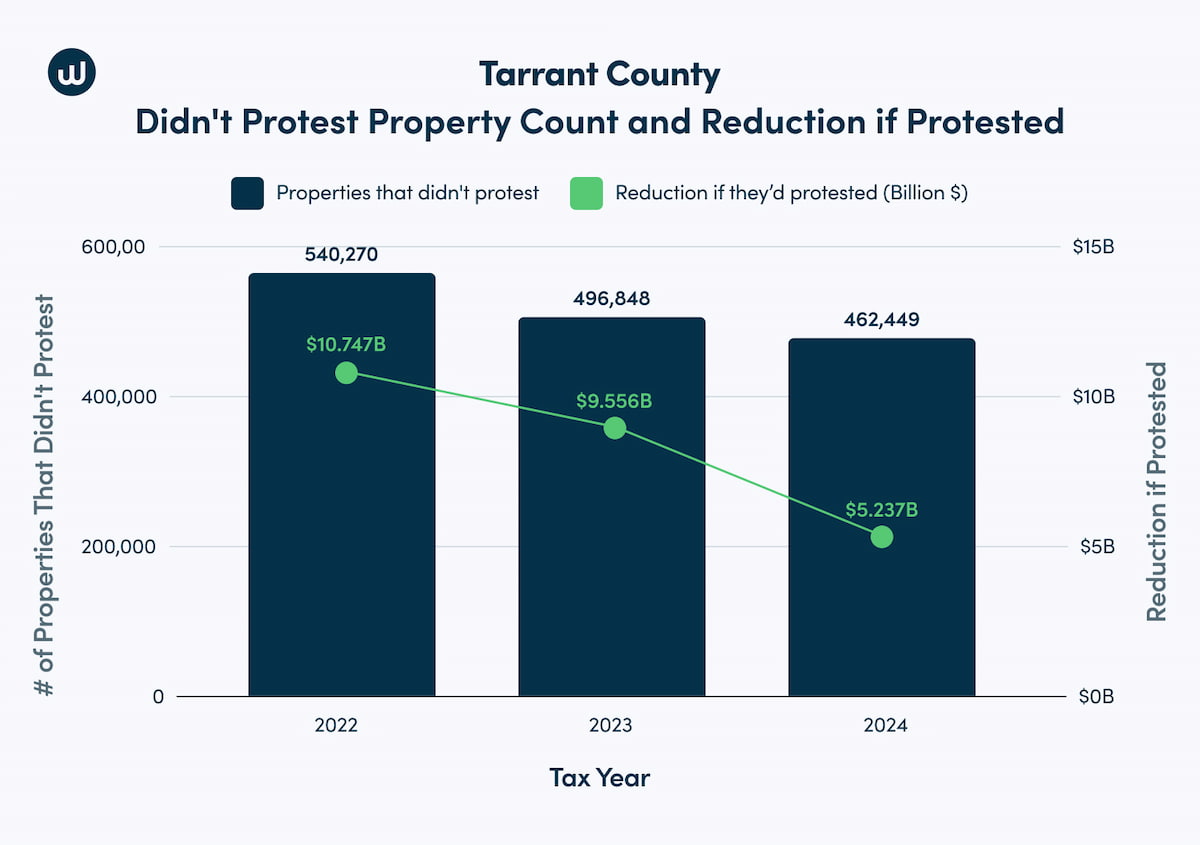
In 2024, 462,449 Tarrant County homeowners didn’t protest their property taxes. Together, these 462,449 homes’ market value totaled $152.33 billion. If they had protested, they’d have reduced their assessed market value by $5.24 billion and saved an estimated $103.67 million on property taxes.
In contrast, those who protested in 2024 (29%) had a lot of success. They had the highest win rate (89.8%) and average reduction percentage (10.1%) of any county.
Tarrant County by the Numbers:
Percentage of properties that protested:
2022: 15.9%
2023: 24%
2024: 29.1%
Average three-year reduction in property valuation when won: 10.1%
Total 2024 tax bill savings from successful protestors: $108.92 million
Total 2022 to 2024 savings from successful protestors: $214.19 million
Number of households who chose not to protest in 2024: 462,449 (71%)
The estimated total reduction in assessed value for all Tarrant County non-protestors from 2022 to 2024 if they had protested: $25.54 billion
Unrealized Savings and Compound Cost of Not Protesting:
Tarrant County market value differences between non-protestors (no reduction) and successful protestors (received a reduction):
2023: 2.47%
2024: 1.31%
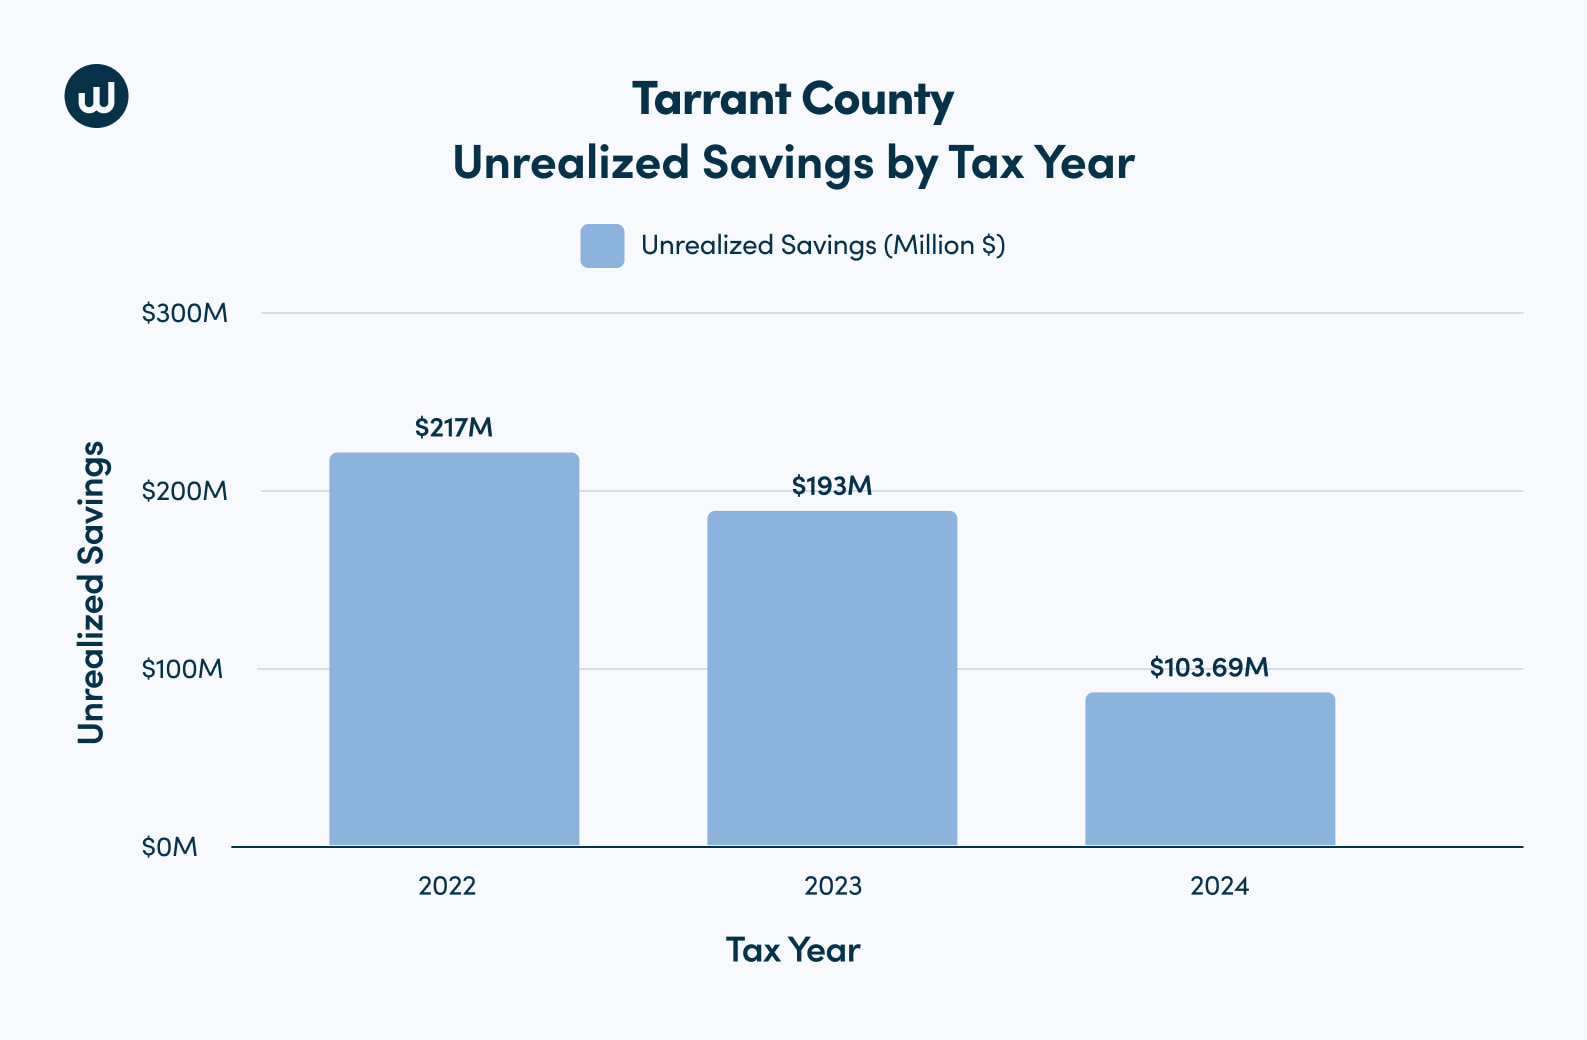
In 2024, homeowners who didn’t protest missed out on potential savings of nearly $104 million.
From 2022-2024, non-protesting Tarrant County homeowners could’ve saved $513.7 million in property taxes.
Travis County
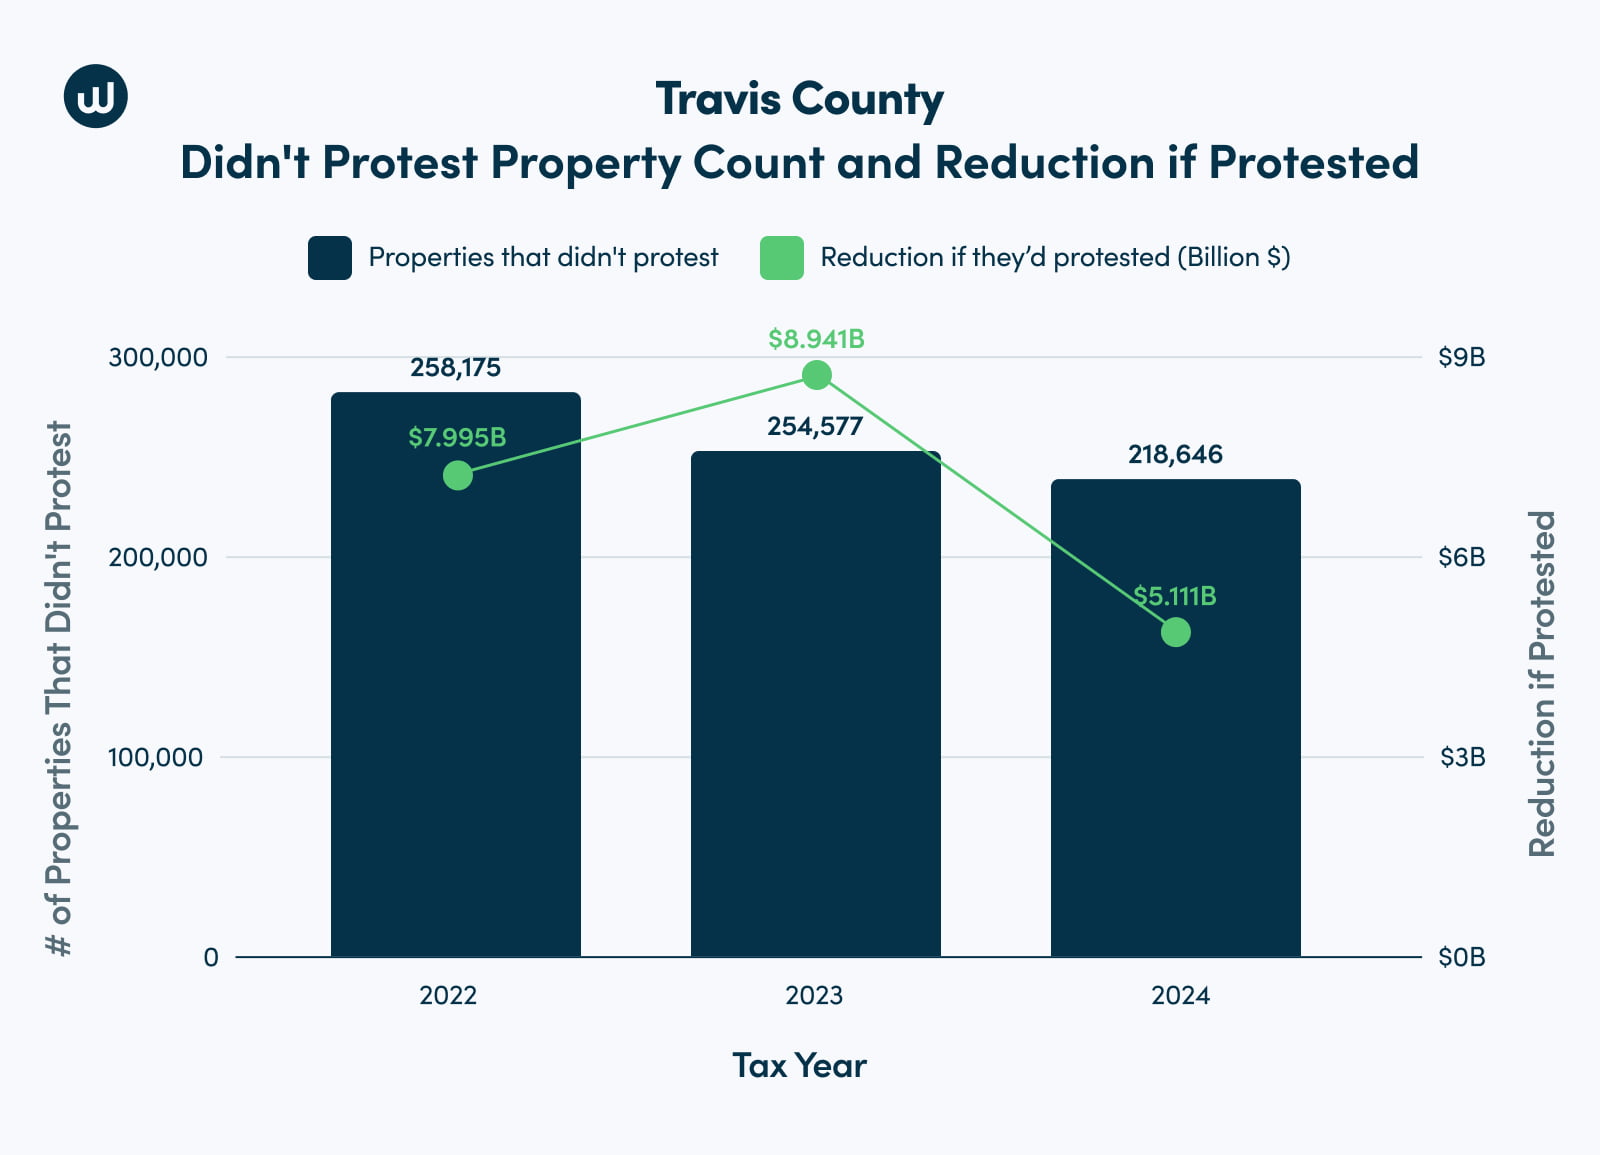
In 2024, 218,646 homeowners didn’t protest their property taxes. Together, these 218,646 homes’ market value totaled $133.69 billion. However, if they had protested in 2024, residents would’ve collectively reduced their property tax bill by $101.67 million. From 2020-2024, they would’ve saved $438.67 million in property taxes.
Conversely, in all three years, Travis County consistently had the highest percentage of residents who protested their property taxes.
In 2024, 41.5% of residents protested. They had the second-highest win rate (88.4%) and average reduction percentage (10.1%), second only to Tarrant County. These protests resulted in over $146 million in tax bill savings!
Travis County by the Numbers:
Success Rate, Reduction, and Savings:
Percentage of properties that protested:
2022: 29.8%
2023: 31.9%
2024: 41.5%
The average success rate for homeowners who protested (2022-2024): 88.4%
Average three-year reduction in property valuation when won: 9.0%
Total 2024 savings from successful protestors: $146.18 million
Total 2022 to 2024 savings from successful protestors: $304.76 million
Number of households who chose not to protest in 2024: 218,646 (58.6%)
The estimated total reduction in assessed value for all Travis County non-protestors from 2022 to 2024, if they had protested: $22.05 billion
Unrealized Savings and Compound Cost of Not Protesting:
Travis County market value differences between non-protestors (no reduction) and successful protestors (received a reduction):
2023: 0.49%
2024: 1.30%
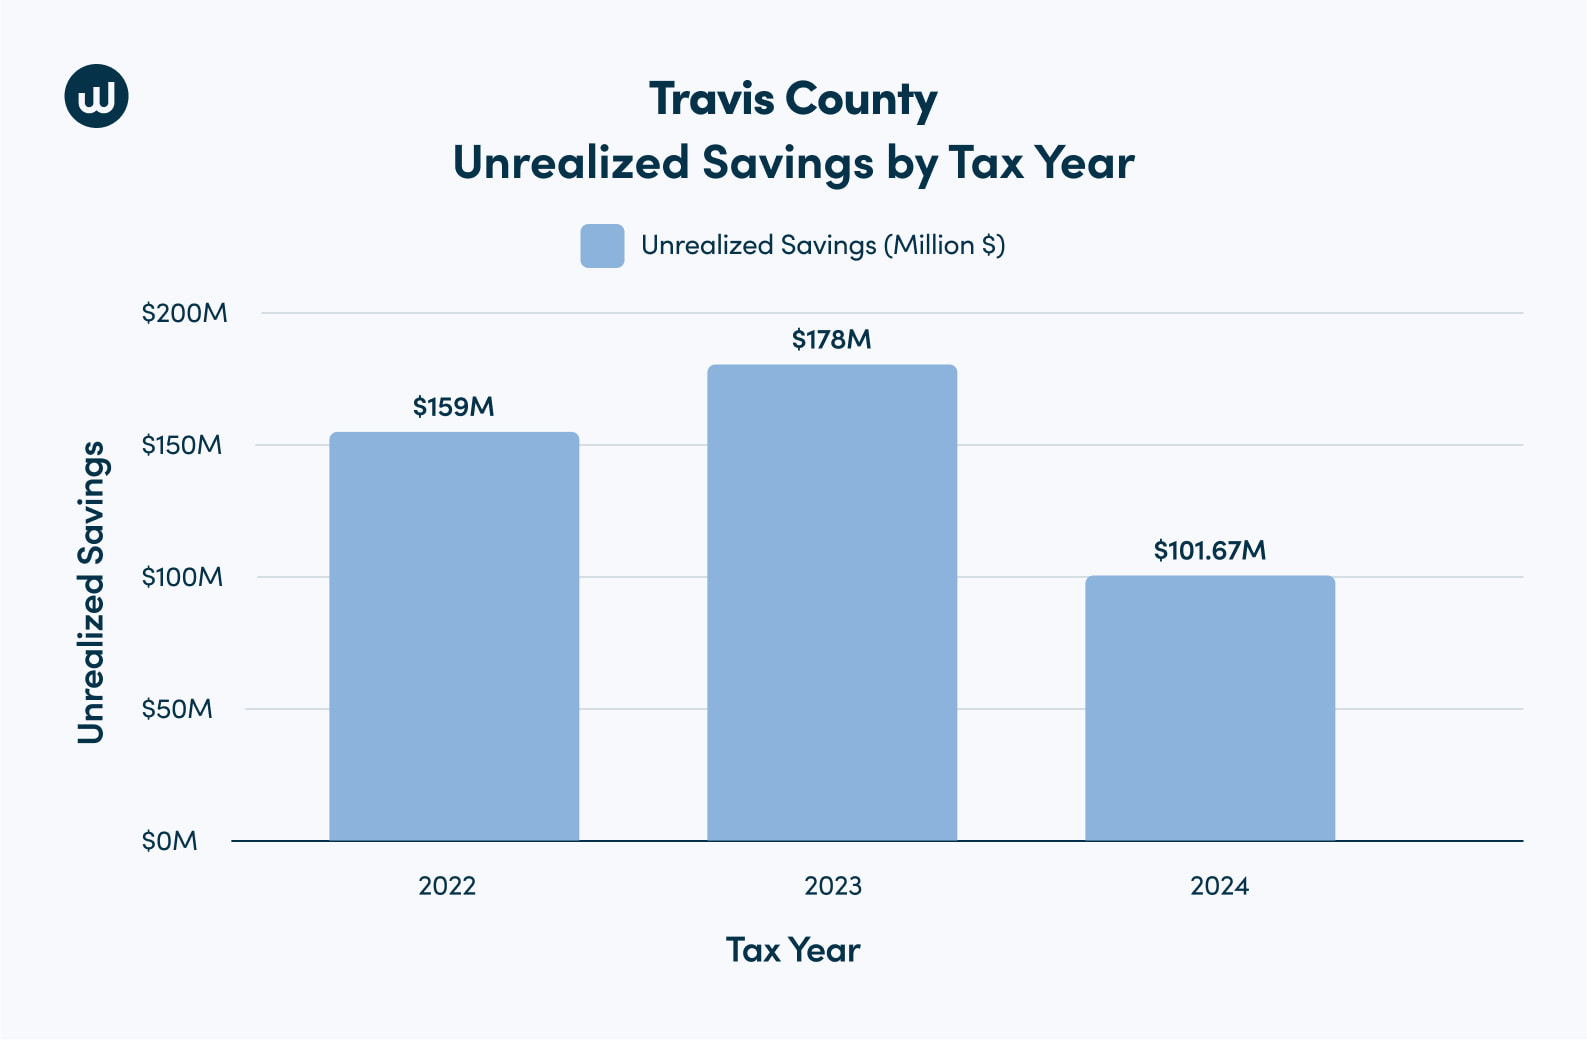
In 2024, homeowners who didn’t protest missed out on potential savings totaling over $101.67 million.
From 2022-2024, non-protesting Travis County homeowners could’ve saved $428.67 million in property taxes.
Homeowners who don't protest could save an entire year's bill every 10 years by protesting regularly.
Start a Property Tax Protest
Clearly, it’s exceptionally beneficial to protest your property taxes, particularly as savings compound annually. If you don’t have the time or patience to save on property taxes, consider using Ownwell to protest your property taxes!
On average, 86% of our clients receive a reduction, saving an average of $1,102 on their tax bill. Even better, you only pay if you save — there are no contingency or upfront fees.
Methodology
We utilized and analyzed county and our own proprietary data from 2022 to 2024 from seven high-density Texas counties to compare YoY market value and tax-saving differences between homeowners who protested their property taxes and received reductions with those who didn’t.
This data included:
The average county tax rate
Number of residents that protested and didn’t protest
Success rate (the percentage of protestors who won their cases and received a reduction)
Total market value from successful protestors and non-protestors
Average reduction percentage for successful protestors
Using the above data, we calculated these four key data points:
The total market value reduction from protestors
Estimated total market value reduction from non-protestors if they’d protested
Tax bill (realized) savings from protestors
Estimated tax bill (unrealized) savings from non-protestors if they’d protested
To calculate protestors’ market value reduction and realized savings, we took into account the percentage of cases won and the market value to beat, which accounted for homestead caps.
Note that the reduced market value unrealized savings for non-protestors and is based on the assumption that non-protestors would receive similar reductions to those that successfully protested. However, this total reduction might differ since more homeowners protesting could change each county's average reduction percentage and win rate.
However, this approach is consistent across counties and independent of market conditions.

